singlem appraise
SingleM can be used to determine how much of a community is represented in an assembly or represented by a set of genomes.
The assessment is carried out by comparing the set of OTU sequences in the assembly/genomes to those found from the raw metagenomic reads. A similar metric can be estimated by the fraction of reads mapping to either the assembly or the genome, but the approach here is more flexible and has several advantages:
- We can determine which specific lineages are missing
- We can match OTU sequences imperfectly, so we can e.g. make statements about whether a genus level representative genome has been recovered
- Since the metric assesses only single copy marker genes, the appraisal is on a per-cell basis, not per-read
- Some care must be taken, but we can prevent Eukaryotic DNA from skewing the estimate
To assess how well a set of sequences represent a metagenome, first run pipe
on both the genomes and the raw reads, and then use appraise:
singlem pipe --sequences raw.fq.gz --otu-table metagenome.otu_table.csv
singlem pipe --genome-fasta-files my-genomes/*.fasta --otu-table \
    genomes.otu_table.csv
singlem appraise --metagenome-otu-tables metagenome.otu_table.csv \
    --genome-otu-tables genomes.otu_table.csv
One may also accommodate some sequence differences, with --imperfect, or
output OTU tables of those sequences that match and those that do not (see
singlem appraise -h). Assessing assemblies is similar to assessing genomes,
except that when assessing bins duplicate markers from the same genome are
excluded as likely contamination.
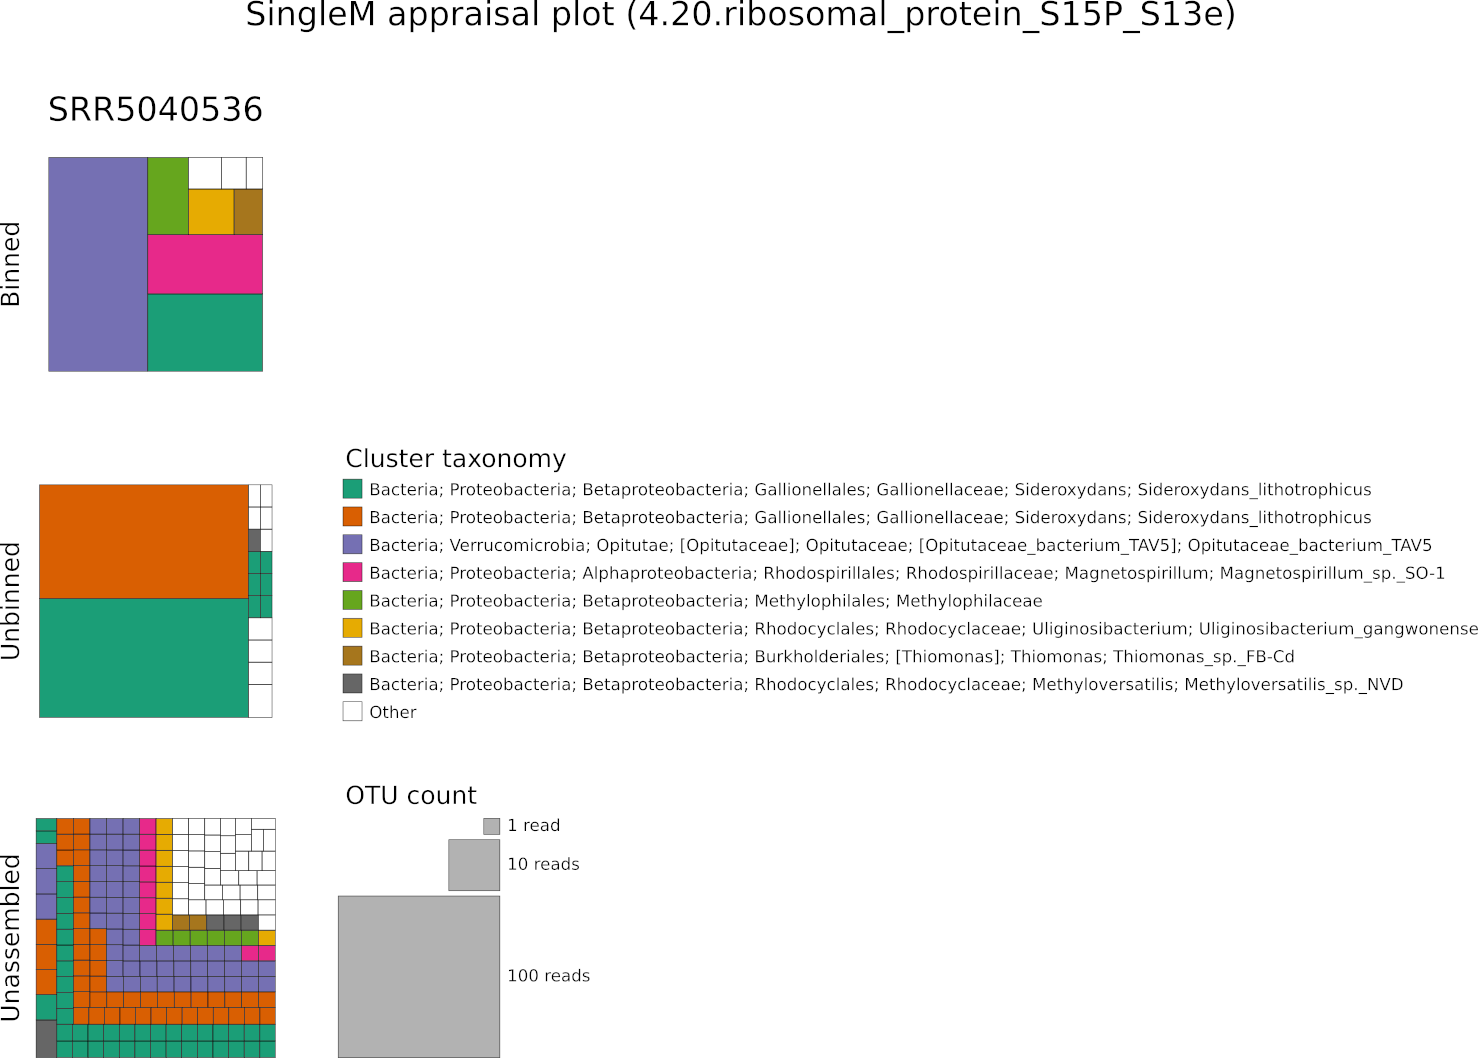
An appraisal can also be represented visually, using appraise --plot:

Each rectangle represents a single OTU sequence where its size represents its
abundance (the number of reads that OTU represents in the metagenome). Colours
represent 89% OTU clustering of these sequences (~genus level), with the
taxonomy of the most common sequence written out. Here we see that highly
abundant OTUs in SRR5040536 were assembled, but only 1 of the 3 abundant
Gallionellales OTUs has an associated bin. As is common, the highest abundance
lineages did not necessarily assemble and bin successfully. The marker
4.20.ribosomal_protein_S15P_S13e was chosen as the representative marker
because it has a representative fraction of OTUs binned, assembled and
unassembled.
INPUT OTU TABLE OPTIONS
--metagenome-otu-tables METAGENOME_OTU_TABLES [METAGENOME_OTU_TABLES ...]
output of 'pipe' run on metagenomes
--metagenome-archive-otu-tables METAGENOME_ARCHIVE_OTU_TABLES [METAGENOME_ARCHIVE_OTU_TABLES ...]
archive output of 'pipe' run on metagenomes
--genome-otu-tables GENOME_OTU_TABLES [GENOME_OTU_TABLES ...]
output of 'pipe' run on genomes
--genome-archive-otu-tables GENOME_ARCHIVE_OTU_TABLES [GENOME_ARCHIVE_OTU_TABLES ...]
archive output of 'pipe' run on genomes
--assembly-otu-tables ASSEMBLY_OTU_TABLES [ASSEMBLY_OTU_TABLES ...]
output of 'pipe' run on assembled sequence
--assembly-archive-otu-tables ASSEMBLY_ARCHIVE_OTU_TABLES [ASSEMBLY_ARCHIVE_OTU_TABLES ...]
archive output of 'pipe' run on assembled sequence
--metapackage METAPACKAGE
Metapackage used in the creation of the OTU tables
INEXACT APPRAISAL OPTIONS
--imperfect
use sequence searching to account for genomes that are similar to those found in the metagenome [default: False]
--sequence-identity SEQUENCE_IDENTITY
sequence identity cutoff to use if --imperfect is specified [default: ~species level divergence i.e. 0.9666666666666667]
PLOTTING-RELATED OPTIONS
--plot PLOT
Output plot SVG filename (marker chosen automatically unless --plot-marker is also specified)
--plot-marker PLOT_MARKER
Marker gene to plot OTUs from
--plot-basename PLOT_BASENAME
Plot visualisation of appraisal results from all markers to this basename (one SVG per marker)
OUTPUT SUMMARY OTU TABLES
--output-binned-otu-table OUTPUT_BINNED_OTU_TABLE
output OTU table of binned populations
--output-unbinned-otu-table OUTPUT_UNBINNED_OTU_TABLE
output OTU table of assembled but not binned populations
--output-assembled-otu-table OUTPUT_ASSEMBLED_OTU_TABLE
output OTU table of all assembled populations
--output-unaccounted-for-otu-table OUTPUT_UNACCOUNTED_FOR_OTU_TABLE
Output OTU table of populations not accounted for
--output-found-in
Output sample name (genome or assembly) the hit was found in
--output-style {standard,archive}
Style of output OTU tables
--stream-inputs
Stream input OTU tables, saving RAM. Only works with --output-otu-table and transformation options do not work [expert option].
--threads num_threads
Use this many threads when processing streaming inputs [default 1]
OTHER GENERAL OPTIONS
--debug
output debug information
--version
output version information and quit
--quiet
only output errors
--full-help
print longer help message
--full-help-roff
print longer help message in ROFF (manpage) format
AUTHORS
Ben J. Woodcroft, Centre for Microbiome Research, School of Biomedical Sciences, Faculty of Health, Queensland University of Technology
Samuel Aroney, Centre for Microbiome Research, School of Biomedical Sciences, Faculty of Health, Queensland University of Technology
Raphael Eisenhofer, Centre for Evolutionary Hologenomics, University of Copenhagen, Denmark
Rossen Zhao, Centre for Microbiome Research, School of Biomedical Sciences, Faculty of Health, Queensland University of Technology
Powered by Doctave
